Hammer Pattern: A Key Signal in Technical Analysis
Hammer Pattern:
When Hammer Pattern is found then it’s a sign of reversal, especially due to its rising bullish signal. This pattern is mainly employed in identifying a reversal zone. This pattern is of great significance because it gives the traders a chance to make plans and decisions concerning change in the market especially when it occurs at the bottom of down markets. This is because once mastered, the hammer pattern starts doing such tacticians quite well in enhancing their strategies.
What is the Hammer Pattern?
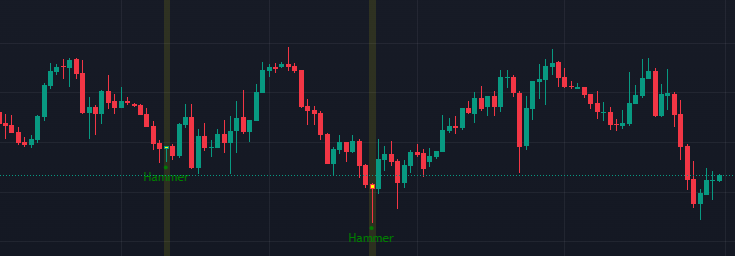
Its description as a hammer shows its intent. The definition of a hammer pattern is that it is a single candlestick charting pattern and thus price change is about to happen. A hammer usually consists of one candlestick a small body and a bottom shadow with little or no upper shadow. It can be said that this is a ‘long’ lower shadow which is tolerated but must in any case be at least ‘twice’ the length of the body. This is a bullish reversal pattern and generally forms at the end of a downtrend suggesting that some buyers are coming into the market and would start pushing the price higher. The hammer pattern applies when the favor of the market starts on the bearish side and it gradually shifts to favor the bull.
What is a Hammer Pattern, and how does one Recognize it?
When using the hammer candlestick pattern, focus on the price action around the candlestick that has a small body but a long lower wick. The body of the candle may be either green (bullish) or red (bearish). The color may not be of so much importance, but the structure of the candlestick pattern is more worth paying attention to. The hammers, as a definition within themselves, must have the following characteristics:
• A small body within the highest fixed price range.
• A long lower shadow with the body center extending twice or more lower than the body.
• Minimal upper shadow if no upper shadow clears the body of this type of candle.
These aspects of the Hammer pattern make it very straightforward to spot on a market ‘price’ chart. Such formations are mostly sought when a bearish move nears its end so that traders can close any short positions taken before the change in trend.
The Inner Workings of the Hammer Pattern
Now shifting our focus toward the working psychology of the hammer pattern, one has to appreciate the reason why it functions. Upon down trends, it is the sellers who are dominant making the prices go even lower. In the case of the hammer, this reversed indicator pattern says that the sellers also pressed down further on the price but such efforts were in vain. Then, the due prices rose instead when the owners of the market purchased the fallen price, forming a long lower shadow. This movement is characteristic of buyers having built enough momentum to reverse the prevailing trend.
The hammer pattern has been likened to opposition between buyers and sellers. If there is a close of a candle that nears its opening price and it is after the close of the previous candle, it means that demand is not running out because of already previous selling… and so the price has gone lower than where it started. It is this change of mind that accompanies the development of the hammer pattern that makes it one of the most tolerable bullish reversal patterns.
Classification of Hammer Patterns
There are some hammer pattern styles that every trader must know.
1. Standard Hammer:
It is the most commonly known hammer pattern that has a small body and a very lengthy lower wick. It usually appears at the end of the bearish action and shows that a reverse trend is imminent.
2. Inverted Hammer:
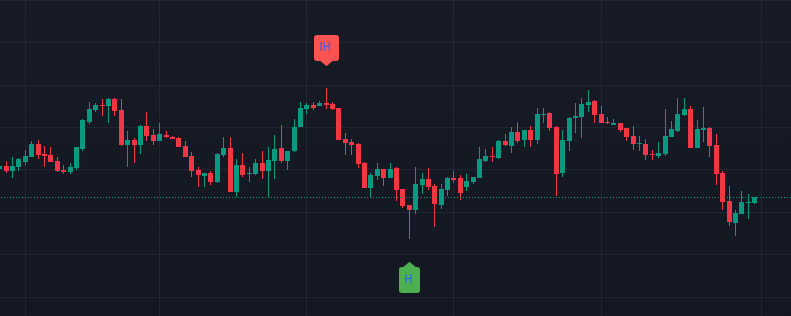
The inverted hammer might be the ascending hammer but in this case the kagi body is shorter than the wick which is at the top end. This is also a reverse pattern that comes after a downtrend, but the accuracy of reversal given by the pattern is not as that of the standard hammer.
3. Hanging Man:
The 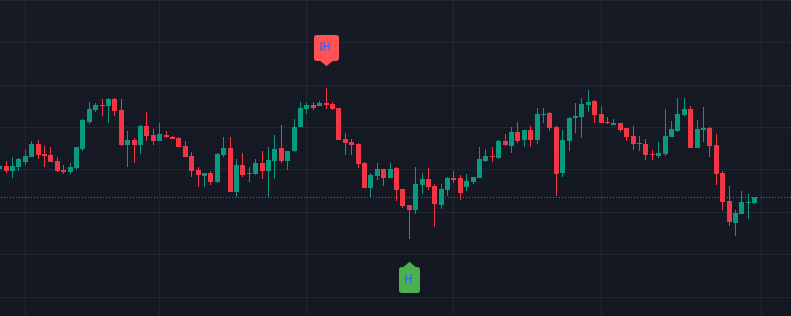 in most cases is confused with the hammer pattern, save for the fact that it is located on top after a bullish movement. The shape also remains as that of a hammer and the price movement is likely more rapid upwards than downwards. Named as a hanging man pattern, it is easy to guess how it will be a bearish reversal pattern.
4. Dragonfly Doji:
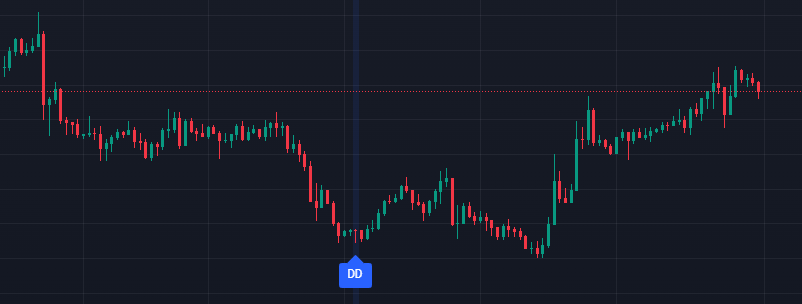
The dragonfly doji may more appropriately be called the doji of the dragonfly or the Doji. The only difficulty is that open, high, and close price levels all resemble these forms of the hammer pattern where there is a long lower shadow and no upper shadow. It also implies that there is no definite direction in the price movements, but when it appears at the end of downward moving patterns, it may also suggest the beginning of a new movement towards the upside.
These and other patterns may give one an idea of how the market behaves but the plain hammer pattern is by far the most misused of them all.
Hammer Pattern Trading
Trading the hammer pattern involves several steps where the hammer pattern is integrated with other lagging indicators. Here are the steps to follow for making a decent trade with the hammer pattern:
1. Identify the Downtrend:
Ensure that the market is down-sloping. The in-hammer pattern therefore is a reversal pattern and forces of which need time to mount after a pull back event.
2. Find the Hammer:
Scan the price chart for any formation of a hammer pattern. Remember, it must be a miniature hammer so to speak with a long thin stock.
3. Confirm the Reversal:
Don’t be too quick to interpret every hammer as a signal for entry; in the majority of the cases, it’s better to wait a little longer and look for a confirmation before opening a position. In this case, confirmation could be a close of any candlestick above the hammer high where the bulls take over hence reversing the ongoing uptrend.
4. Use Support Levels:
For now, try to search for close support levels. If however, the hammer pattern is within the region of a support level, the reversal chances are substantial.
5. Set Stop Loss:
The stop loss should be rather placed beneath the low of the hammer pattern formation. This is to contain risk if the reversal goes awry.
6. Determine Your Target:
This is achieved via targeting the resistance areas that lie closer to where the trade was entered or employing the best risk-reward ratio possible.
7. Monitor the Trade:
Utilize the trade as warranted and exit the trade the moment the market starts getting weaker.
Hammer patterns are very good and they perform their role very well only if they are used together with the rest of the technical analysis tools to improve its performance.
Opposition Reversal Patterns versus Hammer Pattern
Though the hammer pattern indicates a reversal with great emphasis, it should too be put in context with other patterns to assess its advantages and shortcomings.
• Hammer vs. Shooting Star:
In fact shooting star is the opposite of the hammer as it is the bearish variant and is seen after a sequence of bullish candles concluding the bullish trend. It is used in the context of hammer patterns, which are bullish as they signify a trend reversal from a downward to an upward direction.
• Hammer v/s Doji:
The doji is the last of the candlestick chart patterns which also presents oneself as an argument on the status of the movement in the market. This is a pattern that has a tiny body but has long wicks on both ends. Reversals have therefore improved in accuracy as a hammer pattern is a clear sign of upward movement from lower price levels.
• Hammer vs. Engulfing Pattern:
An engulfing pattern is one pattern of reversal sticker which consists of two candles. Thereafter, the body of the first candle in the bullish engulfing pattern today is said to be covered by the second candle. Unlike the hammer reversal pattern, which consists one giant candle, the engulfing reversal pattern has the potential more strength with a lot of confirmation and signals.
Profit hunters should not only view the hammer pattern in isolation but compare it with other patterns in order to determine the best signal to carry out a trading action.
Examples of Hammer Patterns in Trading
The workable hammer patterns worked in different situations of the market.
1. Stock Market:
The hammer pattern is only observed to be present largely on stock market charts and during a market correction or a market pullback. For example, in preparation for a deep low in the price of a stock, one may see an inverted hammer appears which means that the stock is being poised.
A changeover and a new upward trend might come about.
2. Forex market:
The pattern of a hammer is particularly popular in the Forex exchange where it serves the purpose of detecting reversal patterns of a given pair of currencies. Take for example if the trend of a currency pair has been downward for quite some time and at some point a hammer appears, then such a moment is a bullish price reversal.
3. Cryptocurrency Market:
The hammer pattern is not limited to the above analysis where there is mostly focus on the FX markets, it is also utilized beyond this geography and in the cryptocurrency market. Regards to the fact that the assets in the Cryptocurrency sphere are very volatile, The hammer pattern showcases possibilities of a reversal which the traders can capitalize on before that movement takes place.
This is a great case where the hammer pattern is utilized more because it is not restricted to one market or one-time frame and can be used for any specific time frame or for any particular instrument.
Mistakes to Avoid while Trading Hammer Patterns
The hammer pattern is a useful pattern to the traders; however, some mistakes are often committed by many whose outcome negates the hammer pattern. Some of the mistakes that you should ditch include:
1. Not waiting for confirmation:
This is one of the most critical mistakes as one goes into a trade solely based on the hammer pattern and does not wait for any confirmation. It is advisable to wait for the next up-bar to close above the high of the hammer pattern before entering a trade.
2. Ignoring the Overall Trend:
The direction towards which the hammer pattern is formed is also very important since it is a reversal pattern. Do not try and trade a hammer pattern in the direction of an obvious trend like an up trend with no signs of the trend change.
3. Not Placing Stop Loss Orders:
Avoid Stop losses and it would not be surprising if a trader made huge losses when the market does not reverse as anticipated. A stop loss is normally placed below the lowest price of the hammer ensuring that the investor does not lose too much money in the position.
4. Tracing Orders at Times when Trading Activity is thin:
The relation between volume and price is only valid for a market that has enough participants. Markets that do not have participants who actively buy and sell the commodities are likely to give signals that are of no use and this is the reason why it is wise to look at the market conditions before placing any orders.
5. Hammer Pattern is on all occasions be used without assistance from other patterns:
On the other hand, using the hammer and twelve patterns of trading is blackened by too rosy prospects, and explains why most pedlars advocate unscrupulously for them. It is advisable to add extra filtering methods on the existing signals such as moving averages or trend angles.
Other than that, they should be able to bill themselves on those developments in order to increase the chances of success when trading the hammer pattern.
The Hammer Pattern in Different Timeframes
The hammer formation applies to all ranges from intra day, weekly to monthly charts. However, the usefulness of the pattern tends to differ from one-time frame to another.
• Intraday Trading:
The hammer pattern is additionally effective in making discerning short term trend reversals in the intraday time frame which is also known as intra-period trading. For example, one can probably notice the use of the hammer pattern within a 15-min period intra-day chart on expecting an upward reversal middle during the daily trading activity. However, the intraday patterns can be more erratic too, thus, it is advised to use the hammer pattern in combination with other indicators of intraday characteristics.
• Daily Charts:
Gradually as the time frame goes to the daily chart, the fashion of the hammer pattern is more technical than reversal of the market points within a short span, rather it records reversal points in the market for some time. Generally, the reversal pattern is where daily hammers have formed.
• Weekly and Monthly Charts:
Like daily and monthly uptrends, weekly and monthly charts also help to ascertain and clean regular price changes. But a weekly hammer too could well mark the end of a very long down move and trigger the start of a bull market.
The hammer pattern is quite a liberal one as it can be used in any time frame but the reason for the trades will vary with the reason of trading depending on the time frame the trader is entering into the trades.
Grab The Best Trading Indicator from our Telegram Channel
Join Best Forex/ Crypto Broker Click Here


